Introduction
I recently encountered a problem that had a surprisingly elegant solution. I struggled a lot with solving this issue, so hopefully in writing this post I can save someone else the trouble! For reasons that are irrelevant, I wanted to track the performance of youth fencers across time. National ranking lists are posted each year, but the fencers’ names frequently change from year to year. My solution was to create a dataset of all sets of two names, mark which pairs were matches, then pick a single name to use for each set of names that matched against each other. My mistaken belief was that the second step would be the hardest, but actually the third was the most difficult.
The Problem
The data I had were end-of-season rankings for youth fencers by age, gender, and weapon. The only identifier to link fencers across years was their name and year of birth. However, the names are notoriously difficult to standardize. Some years a kid goes by John, others its Jonathan, and maybe a third time its John Smith IV. Numeric suffixes seemed quite overrepresented among fencers relative to the general population. Some Asian fencers would go by a phonetic spelling of their given name in one year then use an English name in the next.
Solution Part 1: The (Surprisingly) Easy Part
I joined the list of names (along with the other less granular identifiers) to itself on the less granular identifiers to get a list of all pairs of names that had the same age, gender, and weapon. I removed pairs whose last names required more than three deletions, insertions, or single-letter transformations to match (the Levenshtein distance). I then tasked two undergraduate RAs to independently inspect each pair and mark the ones that could be the same name, then resolve any discrepancies in the matches they found.
I had thought this step, reviewing each pair of names, would be the most time-consuming, but it actually was rather quick. The 11,211 were reviewed and mismatched in less than 8 hours of work per RA. A snapshot of the final dataset is shown below.
| match | name_key | name_key2 | gender | weapon | bthyear |
|---|---|---|---|---|---|
| 0 | aaron.ahn | albert.park | Male | foil | 1997 |
| 0 | aaron.ahn | albert.park | Male | foil | 1997 |
| 0 | aaron.ahn | bin.ahn | Male | foil | 1997 |
| 0 | aaron.ahn | royce.wang | Male | foil | 1997 |
| 0 | aaron.ahn | mikolaj.bak | Male | foil | 1997 |
| 0 | aaron.ahn | eric.zhang | Male | foil | 1997 |
Solution Part 2: The Hard Part
After this dataset of matches was created, I needed to identify for each name, all other names that matched with it, then pick one of those names to use as the “real” name. The operations required to do this were surprisingly challenging. Each name appeared in both name_key columns, so any grouping had to be done on two variables. It also requires a consistent operation that will select the same “real” name for each name within the matches. I was struggling to implement this solution on the rectangular dataframe. I needed to group by names in two variables, spread unique values of two variables into multiple columns, then consistently select one of those entries. Certainly, there is a way to do this, but it was not intuitive to me and I suspect it would be quite a slow operation.
Eventually, I realized that instead of trying to operate on the data as a matrix with variables in columns and observations in rows, I should treat the data as a graph. Each name was a node, and edges represent names that were matched. Each connected graph within the disconnected graph of all names represented a single “real” name. To extract what I needed, I just had list each node and which graph it was in, then arbitrarily pick one node from each graph to be the “real” name.1
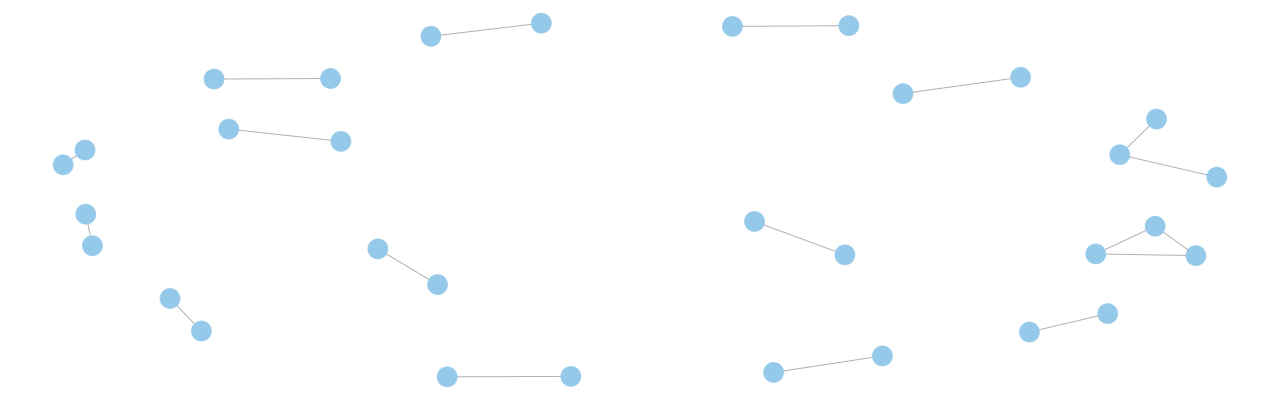
Fortunately, people who write much better R code than me have developed tools to operate on graphs quickly and efficiently. What took me hours to (unsuccessfully) do on a rectangular dataframe took approximately 30 minutes using graph operations. A quick visualization of the graph is below.
graph_plot <- suppressWarnings(graph.data.frame(name_matches[1:100,]  %>% filter(match == 1) %>% select(name_key,name_key2),directed = F))

#remove duplicated edges
graph_plot <- graph_plot %>% simplify()

set.seed(0515) #fix the position of nodes on the plot
ggnet2(graph_plot,label = T,layout.exp=2,color = "lightskyblue2") +
  ggtitle("Sample Name Network") + theme(plot.title = element_text(hjust = .5,face = "bold",size = 15))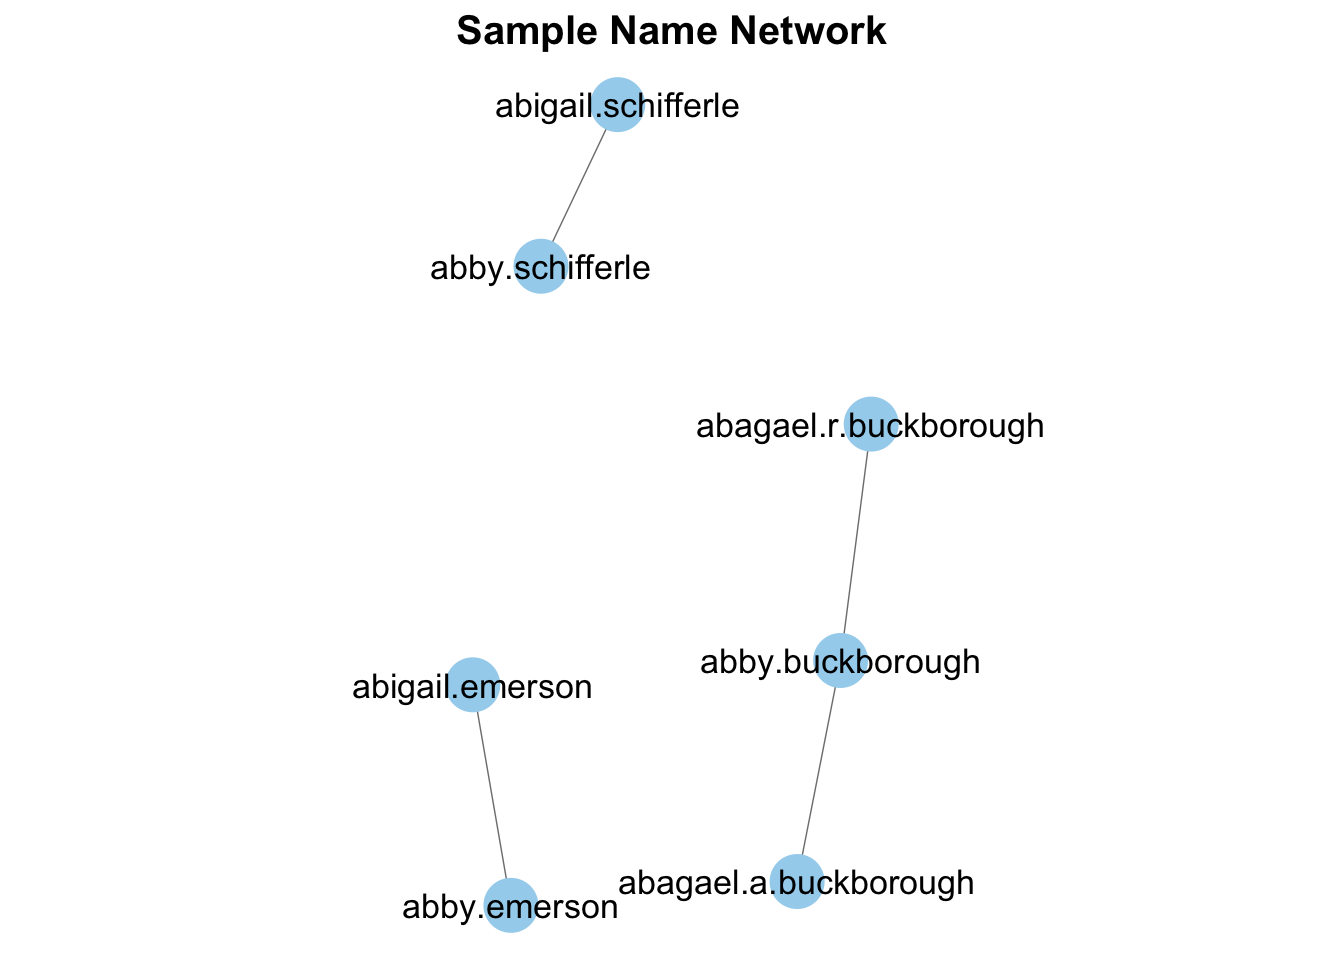
Now here is the code itself. The full script and example data are available at this Github repository.
library(igraph)

#add other identifiers to node names
combine_ids <- function(...){
  str_c(...,sep = "_")
}
name_matches <- name_matches %>% rowwise() %>%
  mutate(name_key = combine_ids(name_key,gender,weapon,bthyear),
         name_key2 = combine_ids(name_key2,gender,weapon,bthyear))

#turn data into a graph
graph <- graph.data.frame(name_matches %>% filter(match == 1) %>% select(name_key,name_key2),directed = F)
dg <- decompose.graph(graph)

#list names of verticies grouped by connected graphs
name_links <- map(dg,function(x){V(x)$name})

#combine into a single dataframe to merge
make_df <- function(list_element){
  vec <- unlist(list_element)
  std_name <- str_split(vec[1],"_",simplify = T)[1]
  data.frame(name_key_combined = vec,std_name = std_name,stringsAsFactors = F)
}
name_standardizations <- do.call(rbind,map(name_links,make_df))

#spread identifiers back into multiple columns
name_standardizations <- name_standardizations %>% separate(name_key_combined,into = c("name_key","gender","weapon","bthyear"),sep = "_")
name_standardizations[1:7,] %>% kableExtra::kable(format = "html") %>%
kableExtra::kable_styling(bootstrap_options = "striped",full_width = F)| name_key | gender | weapon | bthyear | std_name |
|---|---|---|---|---|
| abagael.a.buckborough | Female | sabre | 1999 | abagael.a.buckborough |
| abagael.r.buckborough | Female | sabre | 1999 | abagael.a.buckborough |
| abby.buckborough | Female | sabre | 1999 | abagael.a.buckborough |
| abby.emerson | Female | foil | 1987 | abby.emerson |
| abigail.emerson | Female | foil | 1987 | abby.emerson |
| abby.schifferle | Female | foil | 1988 | abby.schifferle |
| abigail.schifferle | Female | foil | 1988 | abby.schifferle |
The lesson I learned from this experience was the importance of taking a step back from a difficult problem and approaching it from a different angle. Not thinking of data as a matrix of numbers was instrumental to solving this particular problem and is likely key to solving many others.
Incidentally, I think the reason I came up with this idea was I was researching professors at Ph.D. programs I was accepted to, and one of them, Rebecca Steorts, mentioned research on record linkage using graphs in her research interests.↩