The Project
One fateful day while I was bored during a lecture, I decided to sign up for email messages from each Senate campaign during the 2018 election cycle.1 A lot of people study the impact of political advertisements on various outcomes, and I thought some interesting trends might emerge in the email blasts that campaigns send out.
The Data
I signed up using a new email address, and only filled out the required fields to get on mailing lists. I used my real name, the zip code 00000, and a phone number of all zeros. The data for what information I gave to each campaign is on Github. I felt kind of bad signing up for volunteer lists with false information, which were the only email option for some campaigns. The data turned out to be pretty interesting though, so I think next cycle for the presidential election I will try to get on a more comprehensive set of emails by signing up for the House races too and providing zip codes and phone numbers in the relevant district.2
I found the candidates and campaign websites from RealClearPolitics’s Senate map. I started signing up for emails on 6/6/2018, but didn’t sign up for every senate race until 10/9/2018. In the last month before the election (October 6 through November 6 inclusive) I received 2,650 emails from 50 unique campaigns. Some campaigns did not have an option to signup for an email list on their website and some may have filtered out my email address because the zip code and/or phone number were clearly not accurate. Much of the analysis below compares emails from Democrats and Republicans, so I further filter the emails down to races where I received at least one email from both party’s candidates. The final number is 2,397 emails and 44 campaigns. Most analysis uses this sample, and I will specify when that is not the case.
Who is sending emails and when?
I received emails from both parties in the following states: AZ, FL, IN, MA, MD, MI, MN, MO, MS, ND, NE, NJ, NV, NY, OH, PA, TN, TX, USA, UT, VA, VT, WA, WY. A notable omission is West Virginia, where I only received emails from Joe Manchin. Below I show the number of emails I received each day from each party.
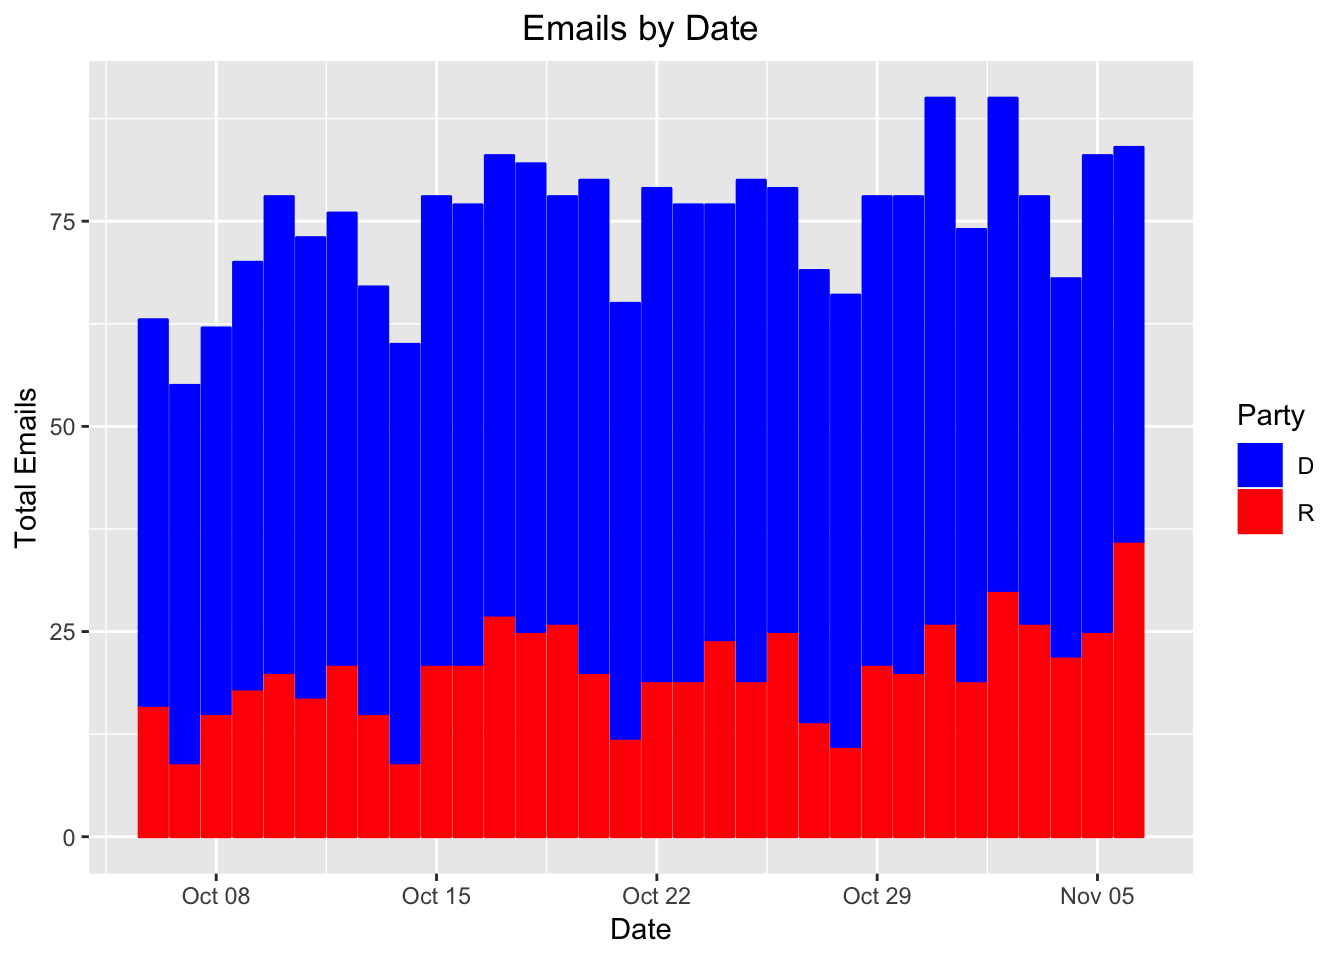
What immediately jumped out to me was that the democratic candidates send significantly more emails (and for some reason campaigns send the fewest emails on Wednesdays). Next, I tally the number of emails I received from each candidate, and show the races where I received at least 100 emails in total.
| State | Party | Campaign | Total Emails |
|---|---|---|---|
| NV | D | Jacky Rosen | 352 |
| NV | R | Dean Heller | 147 |
| FL | D | Bill Nelson | 237 |
| FL | R | Rick Scott | 7 |
| MO | D | Claire McCaskill | 185 |
| MO | R | Josh Hawley | 30 |
| ND | D | Heidi Heitkamp | 176 |
| ND | R | Kevin Cramer | 29 |
| AZ | D | Kyrsten Sinema | 96 |
| AZ | R | Martha McSally | 69 |
| IN | D | Joe Donnelly | 106 |
| IN | R | Mike Braun | 50 |
| USA | D | DNC | 59 |
| USA | R | RNC | 73 |
| MN | D | Amy Klobuchar | 19 |
| MN | D | Tina Smith | 62 |
| MN | R | Karin Housely | 38 |
Jacky Rosen, Bill Nelson, Claire McCaskill, Heidi Heitkamp, and Joe Donnely (all democrats) sent over 100 emails during the relevant time-frame. Dean Heller was the only republican who sent me over 100 emails. In general, Democrats sent more emails than their Republican opponents. However, I certainly would not be surprised if my sample was biased. People who signed up with in-state addresses probably received more emails than I did. I don’t know how sophisticated campaigns are with targeting their emails, but I would be shocked if they did not focus efforts like Get Out the Vote campaigns on people with addresses in their district. I do wonder, though, if there is a connection between the fundraising strategies and email strategies of each party. If Democrats rely more on smaller donations from many individuals, they might need to send more emails to everyone who expresses interest in their campaign. Republicans who either self-fund or court fewer donations from wealthier individuals might simply not have much to gain from emailing out-of-state individuals.
Email Content
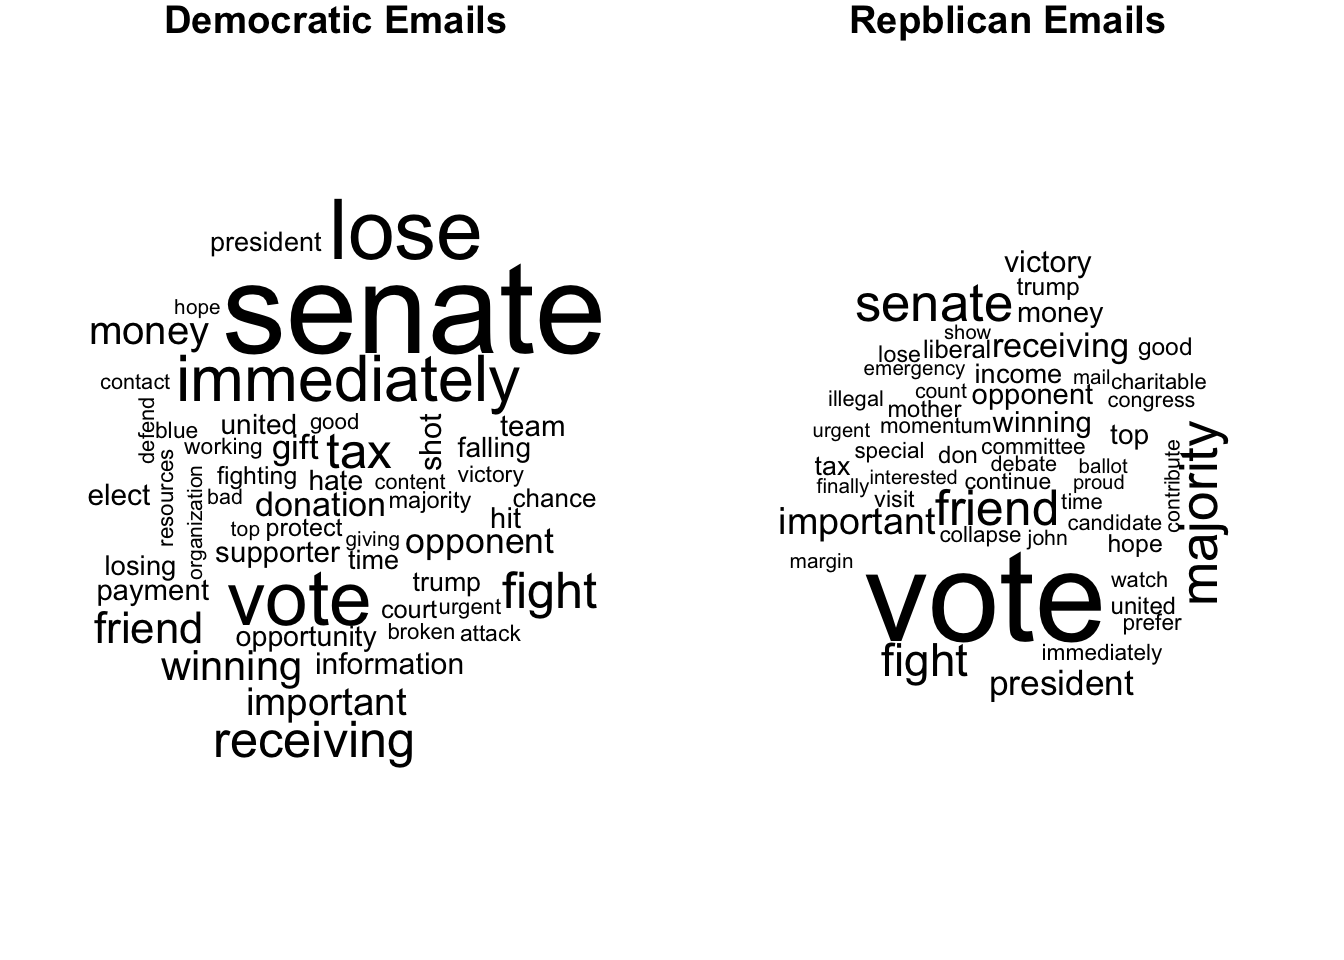
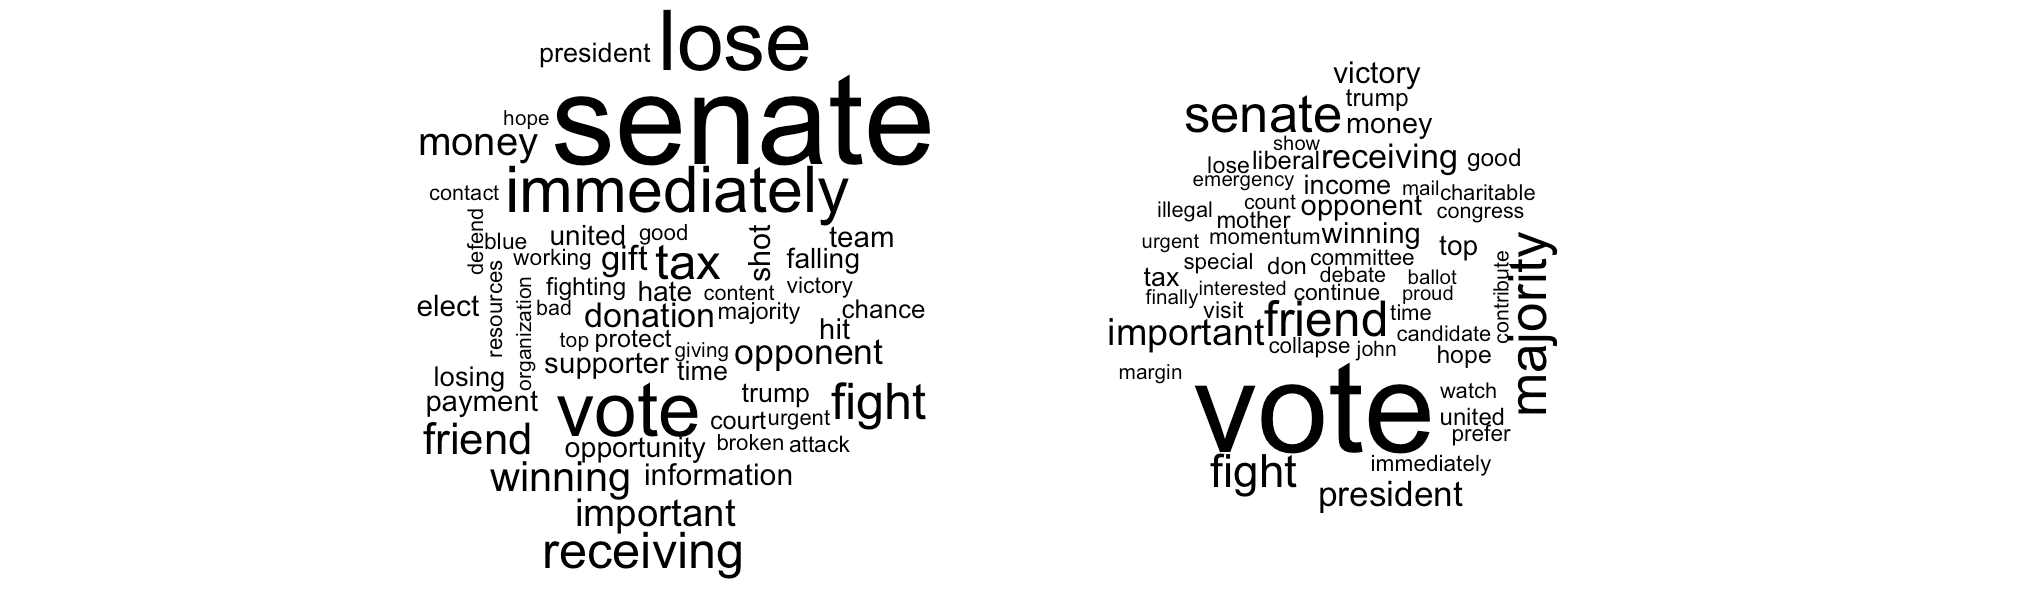
Next, I will analyze the content of the emails. The word clouds above show each word sized proportionally to the amount of times it was used in the email. Both party’s emails frequently used words like senate, vote, and fight, but some differences are already apparent. Here I do unfortunately need to filter the dataset down more. Many of the emails that were sent came in a format that did not download or parse into human-readable text well. I tried to extract the text from all emails, but some (particularly ones with odd formatting or with pictures of text) I could not parse properly. The number of emails analyzed in this section is only 2,043.
Word clouds are a useful visualization, but I will use a statistical technique, the relative risk ratio, to characterize the difference in word-usage between Republican and Democratic emails.
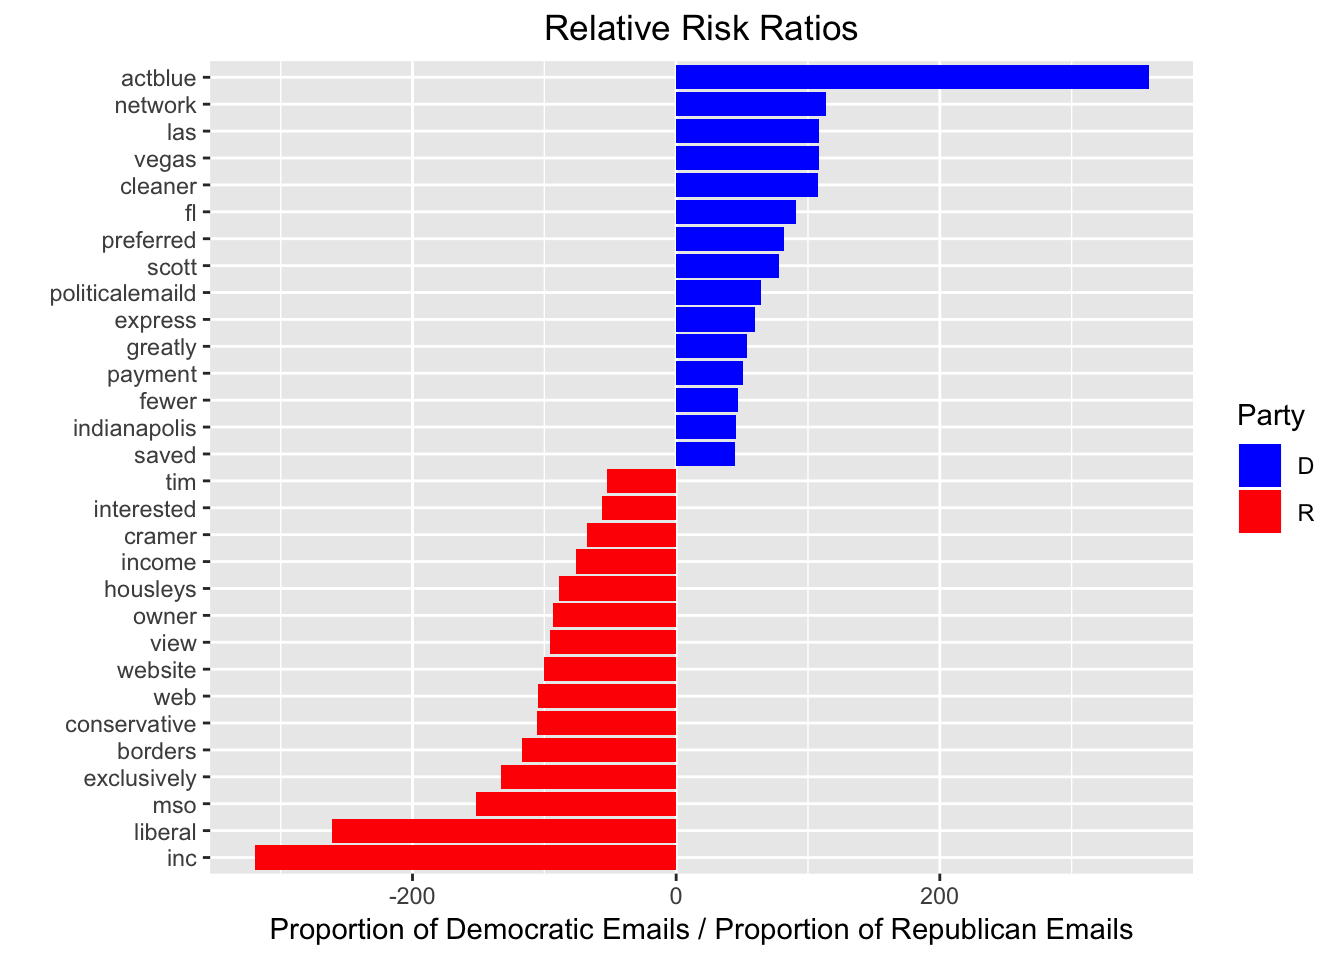
The chart above merits some further explanation. For each word, I calculated the proportion of Democratic emails that used the word and the proportion of Republican emails that used the word. Then, I took the ratio of those two quantities, often referred to as the relative risk ratio. To put everything on a comparable scale, if Republican emails used the word more frequently, I multiplied the proportion by -1 and took the inverse. So if the ratio is equal to R and positive, then Democratic emails used the word R times more frequently. If the ratio is equal to R and negative, then Republican emails used the word R times more frequently. I show the 15 words with the largest ratio for each party.3
Something that I noticed quickly is that election-specific terms from races where the Democrat sent many more emails than the Republican have high risk ratios: “Las Vegas”, “Scott” (Bill Nelson referring to his opponent Rick Scott), and “FL” are all in the top 15 for democrats. “ActBlue” is an organization that helps Democrats fundraise. “politicalemaild” is a truncated version of the email address I provided to campaigns.
I was not surprised that the words “borders” and “conservative” are in the top for Republicans, but I was quite surprised by “web” and “website” showing up in the top 15. “Liberal” is used frequently as a pejorative by Republicans, but apparently Democrats do not use the word anywhere near as frequently when messaging their own supporters.
Of course, words that are used by one party and never used by the other will have a risk ratio of plus or minus infinity. The problem with looking at all of those words is that they often are spelling or parsing errors that happen once or twice for one party and never for the other. To account for that, I show only the 10 most frequently used words that are never used by the opposing party.
| Word | Emails Using Word | Proportion Using Word | Emails Using Word | Proportion Using Word |
|---|---|---|---|---|
| youd | 625 | 0.287 | 0 | 0.000 |
| mitch | 307 | 0.141 | 0 | 0.000 |
| mcconnell | 299 | 0.138 | 0 | 0.000 |
| environment | 262 | 0.121 | 0 | 0.000 |
| fivethirtyeight | 224 | 0.103 | 0 | 0.000 |
| silvers | 217 | 0.100 | 0 | 0.000 |
| nelson | 212 | 0.098 | 0 | 0.000 |
| melbourne | 210 | 0.097 | 0 | 0.000 |
| whitmire | 210 | 0.097 | 0 | 0.000 |
| floridas | 198 | 0.091 | 0 | 0.000 |
| inherit | 0 | 0.000 | 74 | 0.079 |
| nrcc | 0 | 0.000 | 66 | 0.071 |
| chuck | 0 | 0.000 | 62 | 0.067 |
| complaints | 0 | 0.000 | 60 | 0.064 |
| devoted | 0 | 0.000 | 60 | 0.064 |
| conservatives | 0 | 0.000 | 57 | 0.061 |
| suggestions | 0 | 0.000 | 57 | 0.061 |
| replying | 0 | 0.000 | 56 | 0.060 |
| schumer | 0 | 0.000 | 54 | 0.058 |
| charitable | 0 | 0.000 | 53 | 0.057 |
Again, “Florida’s” and “Nelson” show up as top democratic words never used by republicans because I received many emails from Bill Nelson’s campaign and almost none from Rick Scott’s. I was surprised that no Republican emails used the word “you’d.” One potential explanation is that Democrats use more personal apeals in their emails, which is further evidenced by the fact that Democrats used my email address more than republicans. Democrats referenced “Silver’s” “FiveThirtyEight” website in over 200 emails, while Republicans never mentioned either him or the website.
Besides the words that are used most differently, I was also curious how some specific words showed up in emails. Below I tabulate the usage of a few select words. Specifically, I was interested in which politicians get mentioned by each party, some campaign issues, and party signifiers.
| Word | Emails Using Word | Proportion Using Word | Emails Using Word | Proportion Using Word | Signed Risk Ratio |
|---|---|---|---|---|---|
| trump | 365 | 0.168 | 183 | 0.196 | -1.170 |
| obama | 27 | 0.012 | 27 | 0.029 | -2.333 |
| pelosi | 0 | 0.000 | 38 | 0.041 | NA |
| mcconnell | 299 | 0.138 | 0 | 0.000 | NA |
| caravan | 0 | 0.000 | 5 | 0.005 | NA |
| kavanaugh | 54 | 0.025 | 60 | 0.064 | -2.592 |
| radical | 4 | 0.002 | 68 | 0.073 | -39.655 |
| conservative | 3 | 0.001 | 136 | 0.146 | -105.745 |
| liberal | 1 | 0.000 | 112 | 0.120 | -261.253 |
| progressive | 25 | 0.011 | 14 | 0.015 | -1.306 |
While Trump and Obama were mentioned in about 30% of emails by both Democrats and Republicans, congressional leaders were almost exclusively mentioned by the opposing party. Democrats mentioned Mitch McConnell in about 16.5% of their emails, while he was never mentioned by Republicans. Republicans mentioned Nancy Pelosi in about 9% of their emails, while she was mentioned in only 0.5% of democratic emails. This seems to lend truth to the impression I got from news coverage that Republicans ran against Pelosi and Democrats ran against McConnell.
Email Sentiment
How did the sentiment of emails differ by party? Here I will rely on some of the built-in dictionaries in the tidytext package in R. Sentiment analysis generally refers to matching each word with some sentiment, either on a positive or negative scale or to some (short) list of topics. A review of the dictionaries that I will be using is here.
The simplest way to find the sentiment of a document is to use a dictionary that maps words to whether they express a positive or negative sentiment, give each positive word a weight of +1 and each negative word a weight of -1, then find the average for each document. The chart below does just that. Note that the bounds are at plus or minus 1 because I only take the average over words with a sentiment attached to them.
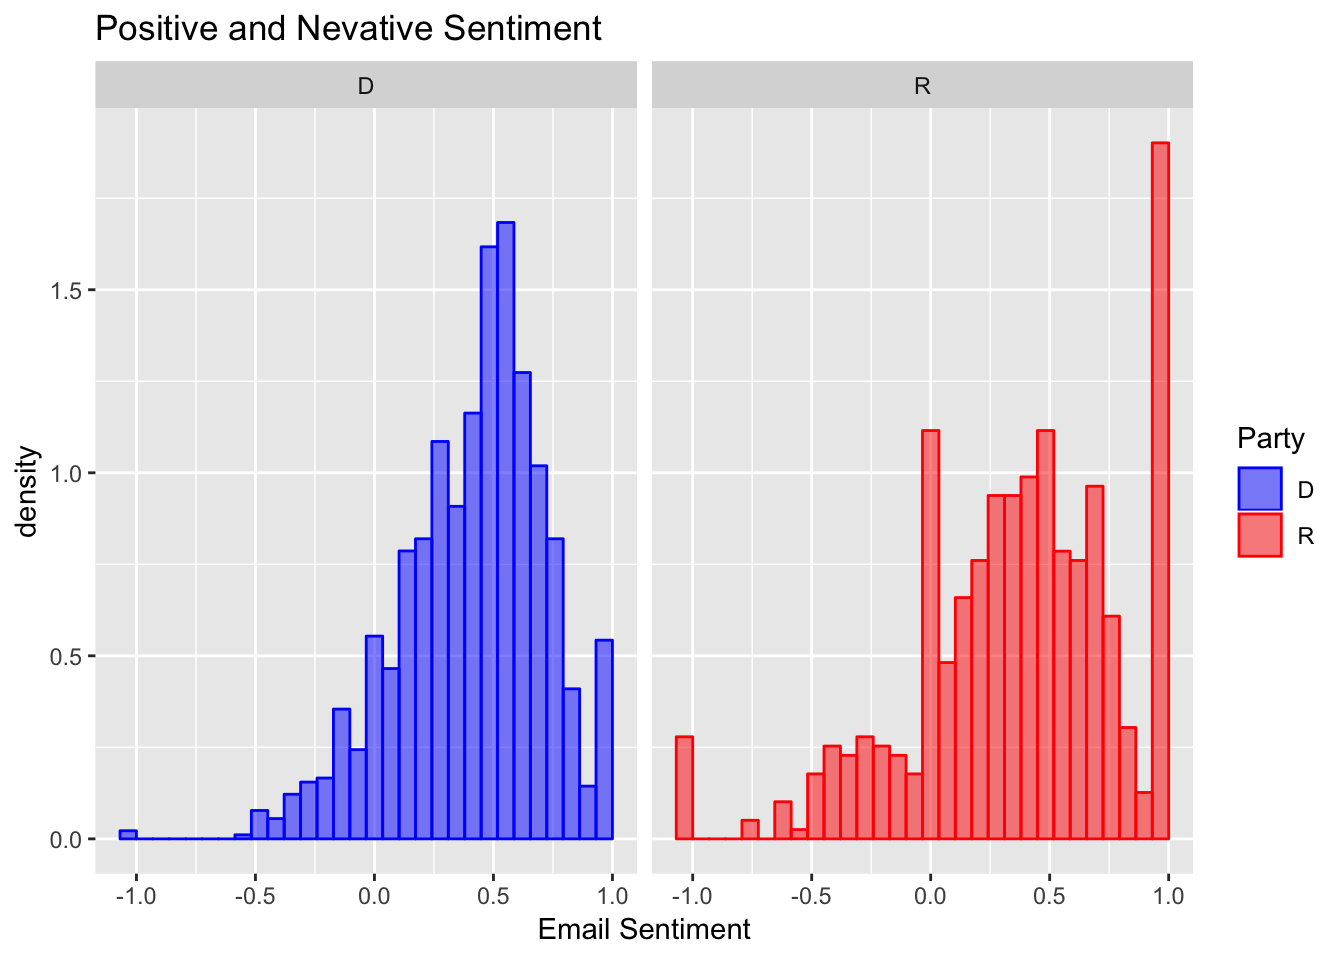
I plotted a density histogram because I received many more democratic than republican emails. The total area of the bars is scaled to sum to one for each party. The results look pretty interesting. For both parties, the distribution of sentiment is concentrated at 0.5, which corresponds to emails that use 75% positive words and 25% negative words. Democratic emails are more concentrated at this value, and the sentiment of Republican emails is more spread out with additional concentrations at plus or minus 1 (all positive or all negative words).
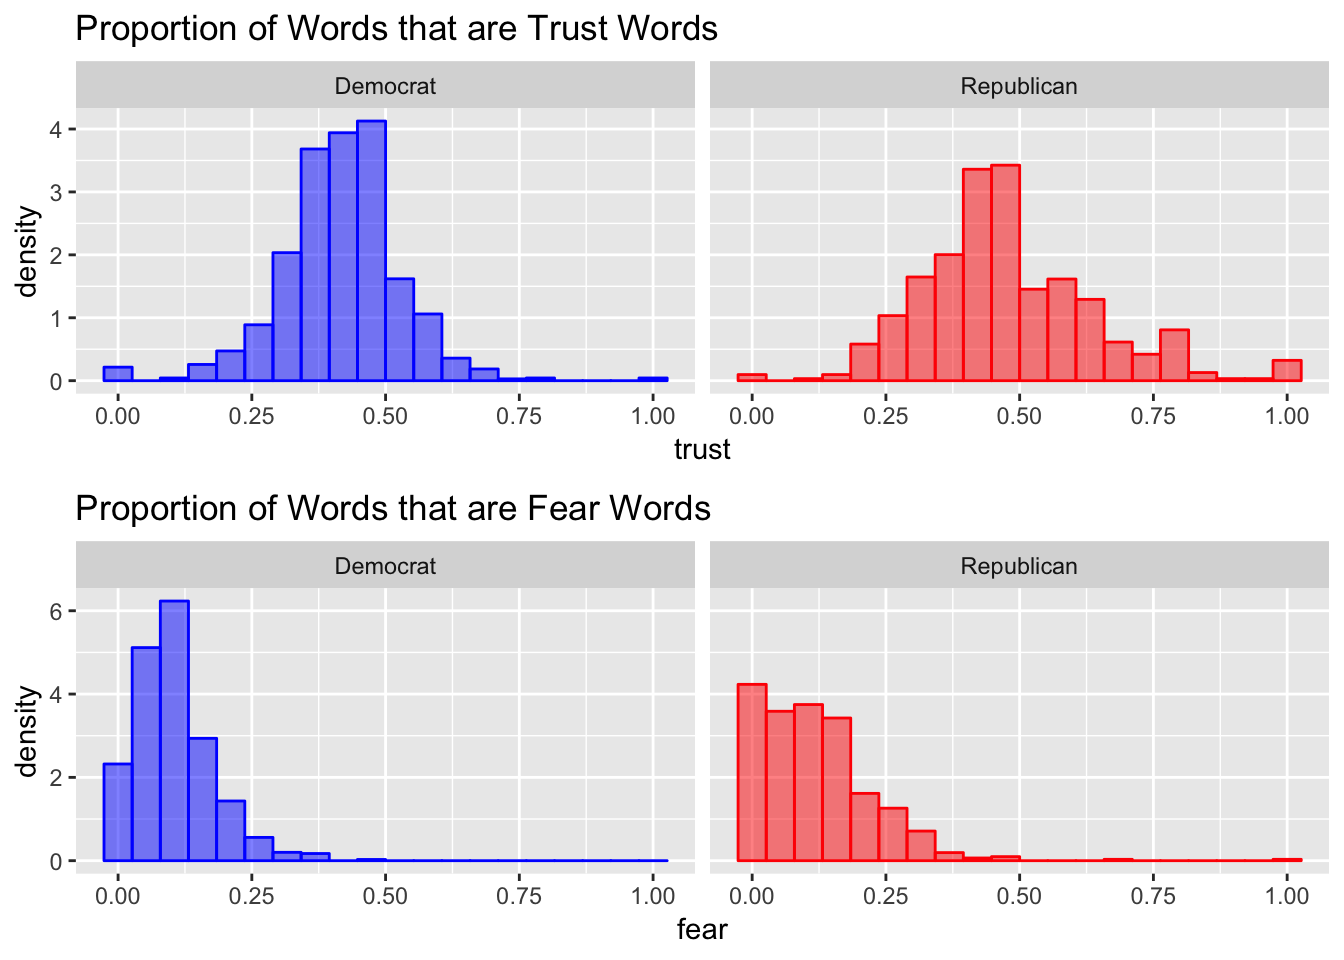
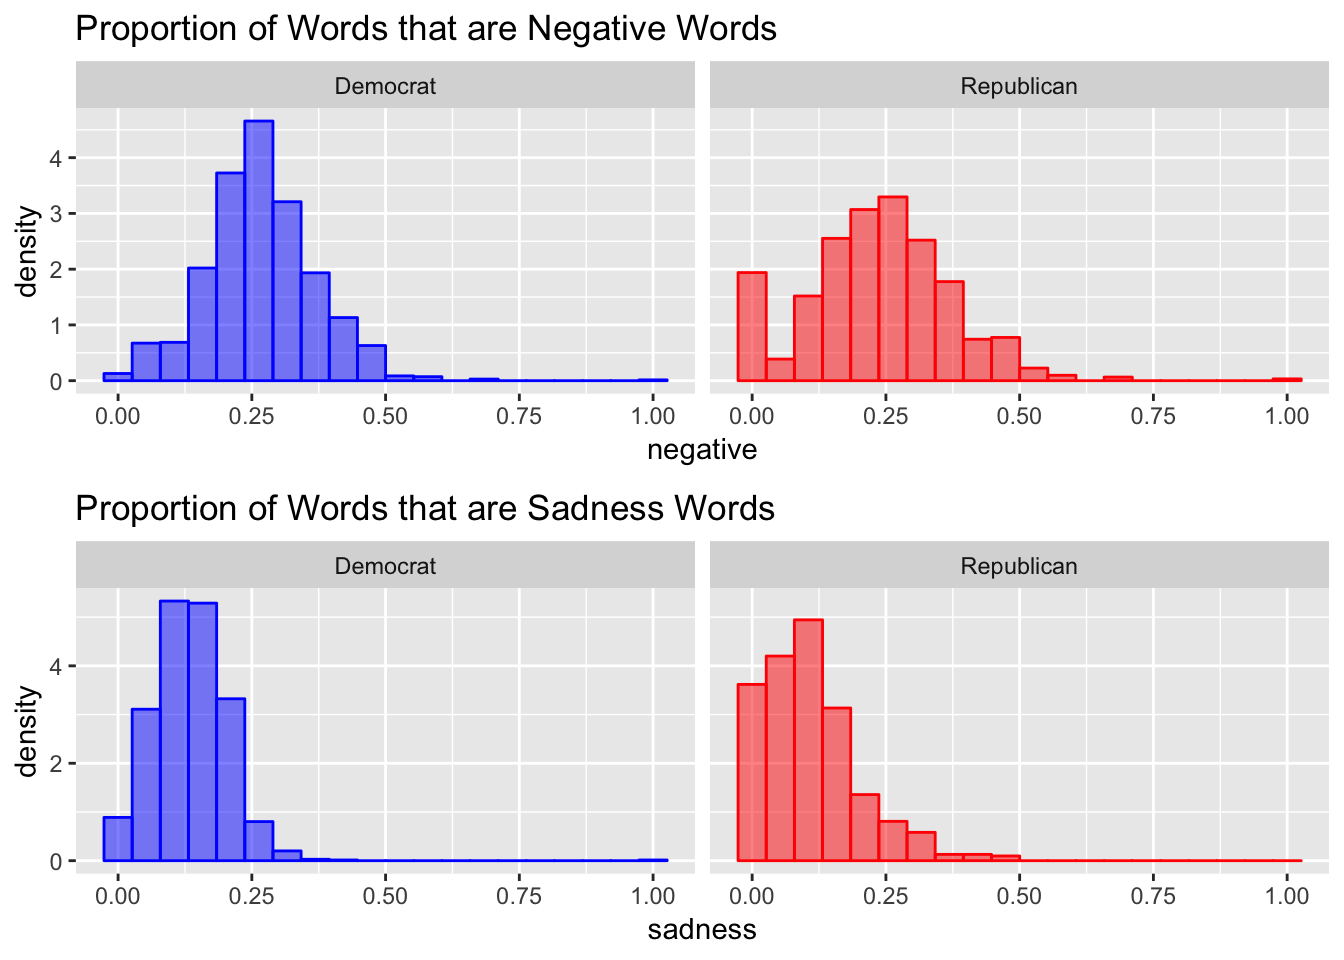
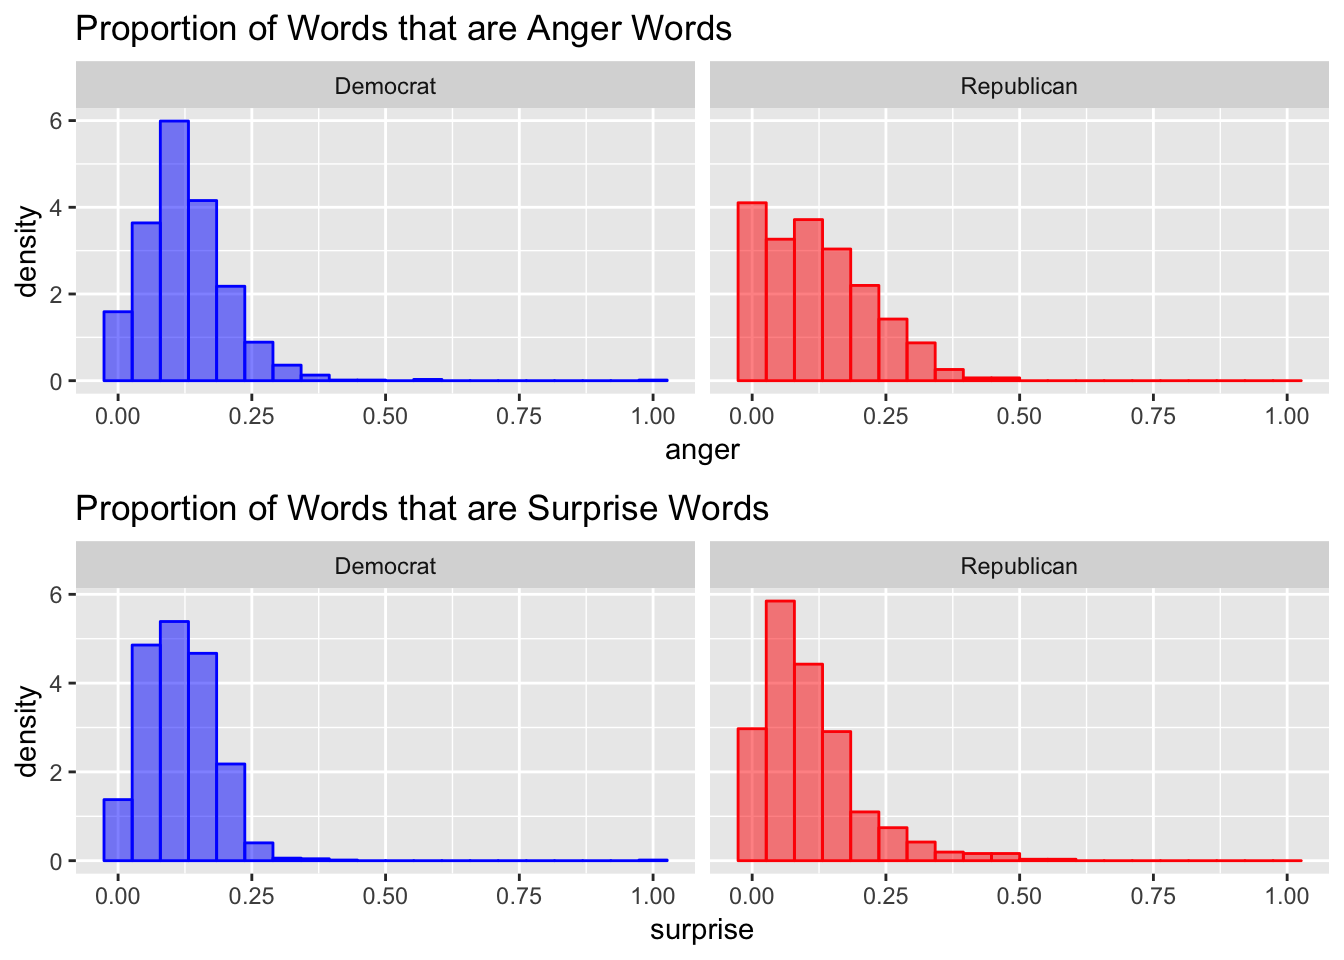
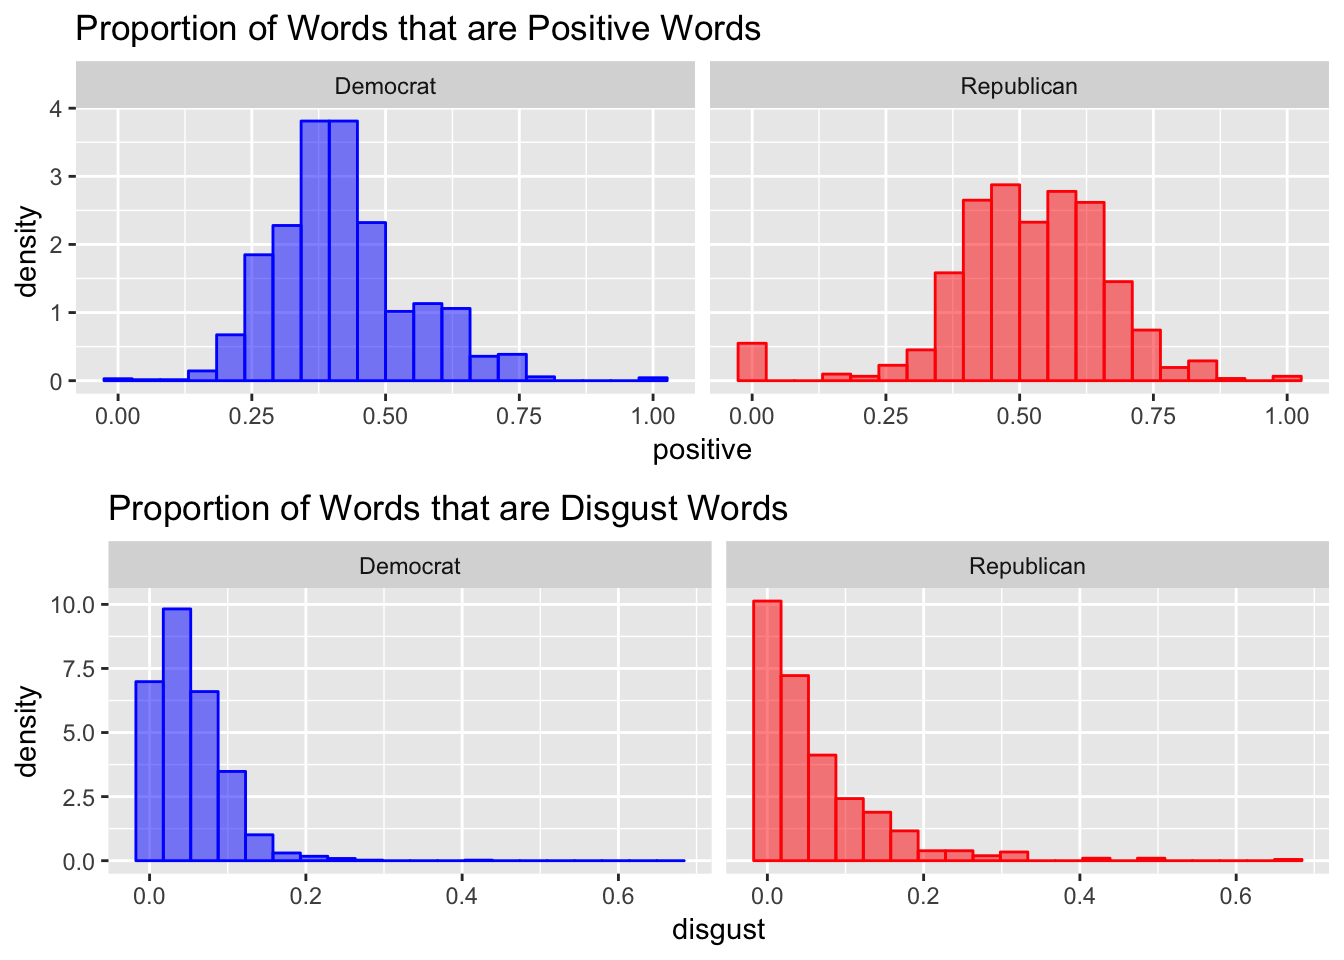
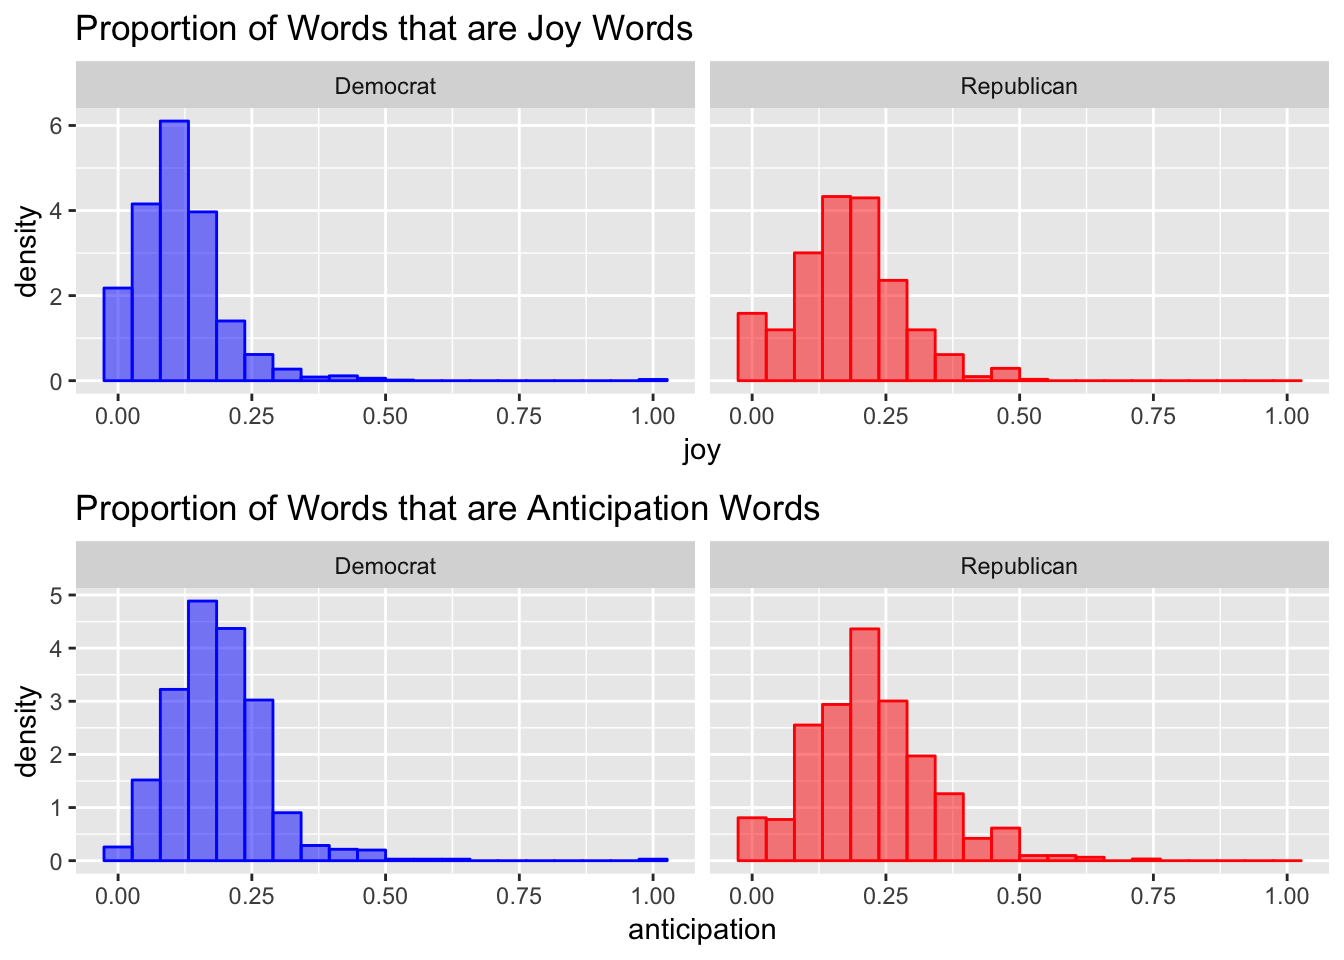
Next I try a slightly more complicated sentiment analysis. I use a dictionary that maps words to (potentially multiple) of the following sentiments: trust, fear, negative, sadness, anger, surprise, positive, disgust, joy, and anticipation. Then, I calculate the proportion of words with the given sentiment among words that had any sentiment for each email and plot a histogram of the results. There are a lot of charts below, but I think they all tell the same story. The overall sentiment of the words used by each party are extremely similar. If all you knew about a campaign email was the sentiment score reported below, it would be extremely hard to correctly guess the party of the candidate.
Classification
Overall, it looks like certain words can give away the political alignment of the email, but the sentiment cannot. However, that conclusion just comes from examining the histograms. A more sophisticated method to measure how well sentiment can identify political text is to fit a prediction model, then test how well it works on a held-out set. If the information about sentiment improves predictive power, then there is evidence that the parties speak to their supporters differently. A recent working paper by Gentzcow, Shapiro, and Taddy measure political polarization by how accurately speeches on the floor of Congress can identify the partisan alignment of the speaker.4 The classification accuracy results here can be interpreted similarly. I will use the two most straightforward techniques that I know of for this task: logistic regression and leave-one-out cross validation (LOOCV).
Logistic regression is a standard method to fit a model to a binary outcome. What I want to do is estimate the probability that an email is from a Democrat as a function of the sentiment scores. A linear relationship will not work because probabilities need to be between zero and one. Logistic regression assumes that the log of the odds of an event (the probability of an email being Democratic divided by the probability of the email being Republican) is a linear function of the explanatory variables. Because of this change in perspective, interpreting the coefficients of a logistic regression is a little bit harder.5 It is still the case, however, that positive coefficients mean an increase in the explanatory variable is associated with an increase in the probability that the dependent variable equals one, so the interpretation of the sign of the coefficient remains the same.
Leave-one-out cross-validation is an evaluation method where a model is fit on all data points except one, then the model is asked to predict the value at the held-out data point, and finally the prediction and observed value are compared. In my application, I code the event that an email comes from a democratic campaign as a one and the event that an email comes from a republican campaign as a zero. If the model predicts that an email is from a Democratic campaign with probability greater than 0.5, I classify it as a Democratic email and as a Republican email otherwise. The LOOCV error rate is the number of miss-classified emails divided by the number of emails.
The explanatory variables I use are all the variables charted above (the average of positive and negative sentiment, called “Email Sentiment”, and each of the categorical sentiments) and the number of sentiment words in each email. To see if results were being driven by a single sentiment, I fit a univariate model with each term individually and a full model with all of the variables included. The results of the univaraite regressions are shown below.
| Model | Coefficient | Intercept | LOOCV Error Rate |
|---|---|---|---|
| Email Sentiment |
0.084** (0.03) |
0.663*** (0.016) |
30.4% |
| Trust |
-0.735*** (0.086) |
1.018*** (0.039) |
28.4% |
| Fear |
-0.454*** (0.126) |
0.746*** (0.017) |
30.3% |
| Negative |
0.391*** (0.097) |
0.596*** (0.027) |
30.4% |
| Sadness |
0.989*** (0.142) |
0.569*** (0.021) |
30.4% |
| Anger |
0.023 (0.128) |
0.693*** (0.019) |
30.4% |
| Surprise |
0.228 (0.145) |
0.67*** (0.019) |
30.4% |
| Positive |
-1.26*** (0.073) |
1.263*** (0.034) |
27.7% |
| Disgust |
-0.611** (0.187) |
0.73*** (0.015) |
30.2% |
| Joy |
-1.692*** (0.109) |
0.926*** (0.018) |
27.1% |
| Anticipation |
-0.883*** (0.107) |
0.871*** (0.024) |
30.1% |
| Number of Sentiment Words |
0 (0.001) |
0.692*** (0.024) |
30.4% |
| Note: | |||
| * p<0.05; ** p<0.01; *** p<0.001 |
While the error rates appear low, they actually are not much better than random chance. Of the 1,880 emails with sentiment data, 69.6% of them are from democratic campaigns. So if you just guessed that every email was Democratic, you would be wrong 30.4% of the time. An equivalent interpretation is that if you randomly classified 69.6% of the emails as Democratic and the rest as Republican, you would expect to have an error rate of 30.4%. Even for some of the sentiments with statistically significant coefficients, their prediction accuracy is no better than random chance. The full model, however, does have some predictive power. The results are shown below.
| Variable | Coefficient |
|---|---|
| Email Sentiment |
0.99*** (0.2) |
| Trust |
-6.511*** (0.704) |
| Fear |
-8.376*** (1.04) |
| Negative |
-2.256* (0.945) |
| Sadness |
6.867*** (1.148) |
| Anger |
3.013** (1.117) |
| Surprise |
1.201 (1.106) |
| Positive |
-7.824*** (0.68) |
| Disgust |
-7.099*** (1.263) |
| Joy |
-3.985*** (1.089) |
| Anticipation |
-1.123 (0.773) |
| Number of Sentiment Words |
-0.002 (0.004) |
| Intercept |
8.438*** (0.646) |
| Note: | |
| * p<0.05; ** p<0.01; *** p<0.001. LOOCV Error Rate: 21.6% |
The error rate for the full model is 21.6%, an improvement over random chance by a factor of about 2/3. By using all of the sentiments together, emails can be classified better than by simply guessing that every email is democratic.
Emails with higher positive average sentiment, or more sadness and anger words are more likely to be democratic emails. Emails with more trust, fear, negative, positive, disgust, or joy words are more likely to be from republican candidates. Democrats might tend to describe the previous Congress with words that convey anger or sadness, while Republicans would use positive, joy, or trust words. The fact that Republican emails also use more disgust and fear words is evidence against that explanation though, or at least is evidence that the truth is more complicated.
Further Work
The classification and cross-validation methods that I used are certainly simpler versions of where the state of the art is. I would not be surprised if more information could be extracted from the text or the sentiments with more sophisticated tools. Something that I haven’t explored, but could be quite interesting, is using the text itself rather than the sentiment to classify emails. The difficulty is that text data is very high dimensional: there were far more unique words used than emails sent. Regression with more variables than observations tends to overfit the estimation data and produce poor out-of-sample predictions. There are also some words that are very predictive, but not predictive in an “interesting” way. Emails always mention the candidate’s name, frequently include a link to the campaign’s donation page or list their mailing address. Clearly, you can immediately know the party of the sender from those features. But those predictions are also not very interesting.
With unlimited time and resources, what I would like to do is extract from the emails some measures of the general language each party uses and then use those features to classify the email. If those features classify accurately, then there is evidence for divergence in how the parties speak to their supporters. That result has implications for trying to convince people to change their political beliefs and how to talk to people from across the isle. Presenting convincing arguments to partisans of each party probably requires speaking their language in some sense, and campaign emails are potentially a useful data source for learning that language.
This project may have been entierly inspired by the fact that I really liked the title.↩
The code and data are on Github here: https://github.com/g-tierney/political_emails.↩
I also removed all non-alphanumeric characters from each word.↩
Technically, a one unit increase in the explanatory variable increases the odds that an event occurs by \(e^\beta\) where \(\beta\) is the estimated logit coefficient.↩